
This WPX vs SiteGround comparison gives you a detailed, data-driven comparison of these two providers across multiple performance metrics, to help you make an informed decision about which service best meets your needs. Let’s dive into the specifics to understand how WPX Hosting stacks up against SiteGround.
 SiteGround |  WPX Hosting | |
|---|---|---|
| Pricing | GoGeek plan starts from $7.99/month | Plans start from $20.83/month |
| SLA | 99.9% uptime | 99.95% |
| Hosting types offered | Shared, Managed hosting for WordPress and WooCommerce, Cloud hosting. | WordPress. |
| Speed and performance | SSD persistent storage. NGINX Direct Delivery. SiteGround CDN. PHP 8.0 and 8.1. Custom PHP and MySQL. GZIP compression, CSS & HTML modifications. SuperCacher and SG Scanner. | LiteSpeed Server. LiteSpeed Cache. OpCache. XDN CDN. PHP 8.0. |
| WordPress | Free WordPress installation. Auto-updates. 1-click staging. Free site migration. | Free WordPress installation. Auto-updates. 1-click staging. Free site migration service. |
| Servers | Google Cloud Platform and SiteGround CDN. | WPX own servers and XDN CDN network. |
| Security | Free SSL certificates. Smart WAF. AI Anti-bot. 24/7 server monitoring. Distributed backups. Free WordPress security plugin. Automatic daily backups. | Brute force protection. Automatic daily backups. Free SSL certificates. ModSecurity firewall with daily scans. Imperva DDoS attack protection. |
| Control Panel | Site Tools (proprietary custom dashboard) | WPX control panel (proprietory) |
| Extra Goodies | 24/7 support. Free email accounts. 100% renewable energy match. | 24/7 support. Free site speed optimization. Free offline site fixes. Unlimited email boxes. |
| Money-back guarantee | 30 days | 30 days |
| Current deal | 🔥 Get up to 83% OFF SiteGround's plans | 🔥 Get 2 months FREE if you pay yearly |
When comparing WordPress hosting providers (something I frequently do), I find that SiteGround achieves the top spot almost every single time.
I mean, what’s not to like? It provides top-notch performance, speed, security, and excellent customer service for a near-unbeatable price.
But is there something faster and, dare I say it, better?
Enter WPX Hosting.
It’s an independently owned service which means it has the freedom to deploy and use whatever tech it wants, set its own prices, and determine the level of service it provides. Additionally, it can tweak or change up its software and optimize it for the fastest possible speeds.
Is it enough to topple SiteGround, though? Let’s find out.
Plans & Pricing
First up, let’s check out how much money you have to lay down every month to get hosting with either of these providers.
WPX Hosting Pricing Plans

WPX Hosting has three managed WordPress plans to choose from:
- Business: $20.83/month if you pay annually; 200 GB bandwidth; five websites.
- Professional: $41.58/month if you pay annually; first two months free; 400 GB bandwidth; 15 websites.
- Elite: $83.25/month if you pay annually; first two months free; unlimited bandwidth; 35 websites.
Paying annually nets you two months’ worth for free, and all plans come with a 30-day money-back guarantee.
Visit WPX.net for more information and the latest deals… or check out my review of WPX Hosting here.
SiteGround Pricing Plans
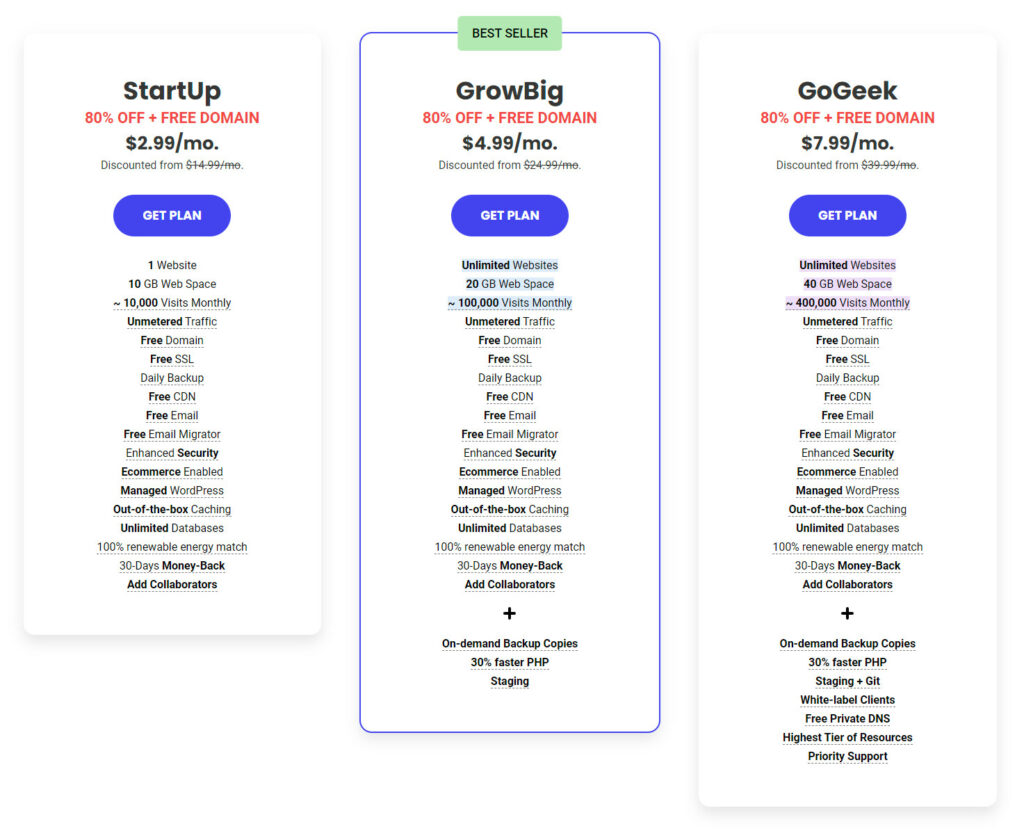
SiteGround also keeps it simple with three plans to choose from:
- StartUp: $2.99/month
- GrowBig: $4.99/month
- GoGeek: $7.99/month
SiteGround’s GoGeek plan is their most powerful plan. With the Startup plan, SiteGround will manage one website, and with the GrowBig and GoGeek plans, they’ll manage unlimited sites for you.
Visit SiteGround for more information and their latest deals… or check out my review of SiteGround here.
🏆 Winner is SiteGround
Although SiteGround’s promotional rates are temporary, they are still hard to ignore. Especially considering there’s nothing else quite like it among WordPress hosting providers.
Even on the standard rates, SiteGround is still much more affordable than WPX Hosting. Therefore, this section is a no-brainer “win” for SiteGround.
Performance, Speed & Reliability
Next up, the reasons why you’d want to host with either SiteGround or WPX Hosting in the first place. Speed and performance are essential for any business website, so let’s see which one delivers the goods.
In this section, you will find out…
- Why site speed matters… a lot!
- How fast a site hosted on WPX and SiteGround loads. We will test their speed and server response time against Google’s Core Web Vitals metrics.
- How a site hosted on WPX and SiteGround performs with traffic spikes. We will test how they perform when faced with increased site traffic.
The most important performance metric that you should look for in a web host is speed. Visitors to your site expect it to load fast instant. Site speed not only affects user experience on your site, but it also affects your SEO, Google rankings, and conversion rates.
But, testing site speed against Google’s Core Web Vitals metrics isn’t enough on its own, as our testing site does not have substantial traffic volume. To evaluate the efficiency (or inefficiency) of the web host’s servers when faced with increased site traffic, we use a testing tool called K6 (formerly called LoadImpact) to send virtual users (VU) to our test site.
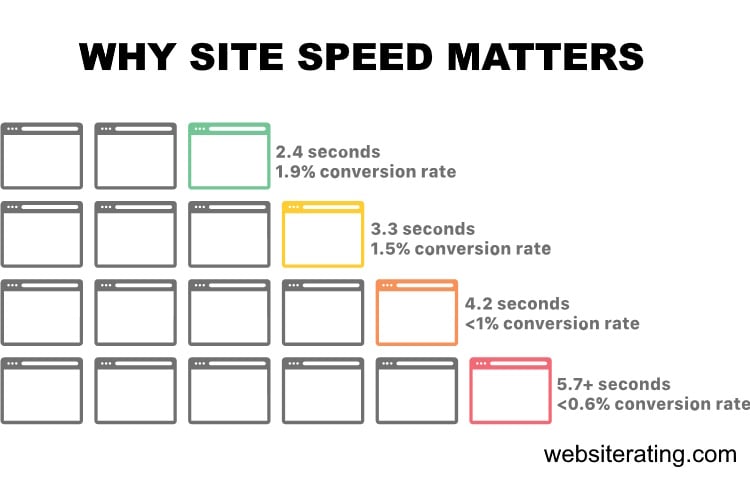
Why Site Speed Matters
Did you know that:
- Pages that loaded in 2.4 seconds had a 1.9% conversion rate.
- At 3.3 seconds, the conversion rate was 1.5%.
- At 4.2 seconds, the conversion rate was less than 1%.
- At 5.7+ seconds, the conversion rate was 0.6%.
When people leave your website, you lose not only potential revenue but also all the money and time you spent generating traffic to your website.
And if you want to get to the first page of Google and stay there, you need a website that loads up fast.
Google’s algorithms prefer displaying websites that offer a great user experience (and site speed is a huge factor). In Google’s eyes, a website that offers a good user experience generally has a lower bounce rate and loads up fast.
If your website is slow, most visitors will bounce back, resulting in a loss in search engine rankings. Also, your website needs to load up fast if you want to convert more visitors into paying customers.
If you want your website to load up fast and secure the first spot in search engine results, you will need a fast web hosting provider with server infrastructure, CDN and caching technologies that are fully configured and optimized for speed.
The web host you choose to go with will significantly impact how fast your website loads.
How We Perform the Testing
We follow a systematic and identical process for all the web hosts we test.
- Buy hosting: First, we sign up and pay for the web host’s entry-level plan.
- Install WordPress: Then, we set up a new, blank WordPress site using the Astra WordPress theme. This is a lightweight multipurpose theme and serves as a good starting point for the speed test.
- Install plugins: Next, we install the following plugins: Akismet (for spam protection), Jetpack (security and backup plugin), Hello Dolly (for a sample widget), Contact Form 7 (a contact form), Yoast SEO (for SEO), and FakerPress (for generating test content).
- Generate content: Using the FakerPress plugin, we create ten random WordPress posts and ten random pages, each containing 1,000 words of lorem ipsum “dummy” content. This simulates a typical website with various content types.
- Add images: With the FakerPress plugin, we upload one unoptimized image from Pexels, a stock photo website, to each post and page. This helps evaluate the website’s performance with image-heavy content.
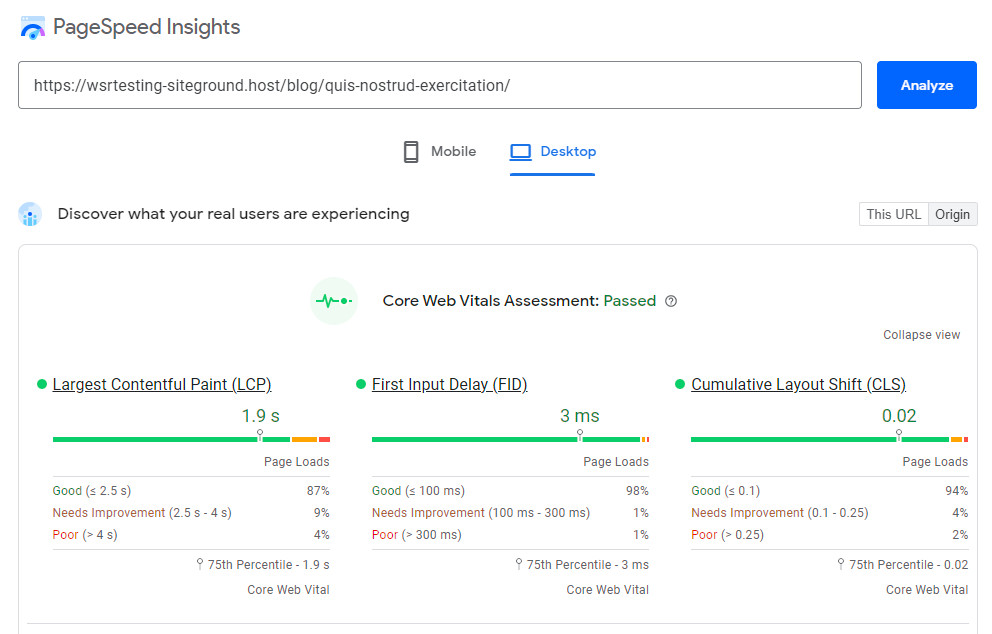
- Run the speed test: we run the last published post in Google’s PageSpeed Insights Testing tool.
- Run the load impact test: we run the last published post in K6’s Cloud Testing tool.
How We Measure Speed & Performance
The first four metrics are Google’s Core Web Vitals, and these are a set of web performance signals that are critical to a user’s web experience on both desktop and mobile devices. The last fifth metric is a load impact stress test.
1. Time to First Byte
TTFB measures the time between the request for a resource and when the first byte of a response begins to arrive. It’s a metric for determining the responsiveness of a web server and helps identify when a web server is too slow to respond to requests. Server speed is basically entirely determined by the web hosting service you use. (source: https://web.dev/ttfb/)
2. First Input Delay
FID measures the time from when a user first interacts with your site (when they click a link, tap a button, or use a custom, JavaScript-powered control) to the time when the browser is actually able to respond to that interaction. (source: https://web.dev/fid/)
3. Largest Contentful Paint
LCP measures the time from when the page starts loading to when the largest text block or image element is rendered on the screen. (source: https://web.dev/lcp/)
4. Cumulative Layout Shift
CLS measures unexpected shifts in the display of content in the loading of a web page due to image resizing, ad displays, animation, browser rendering, or other script elements. Shifting layouts lower the quality of the user experience. This can make visitors confused or require them to wait till the webpage loading is completed, which takes more time. (source: https://web.dev/cls/)
5. Load Impact
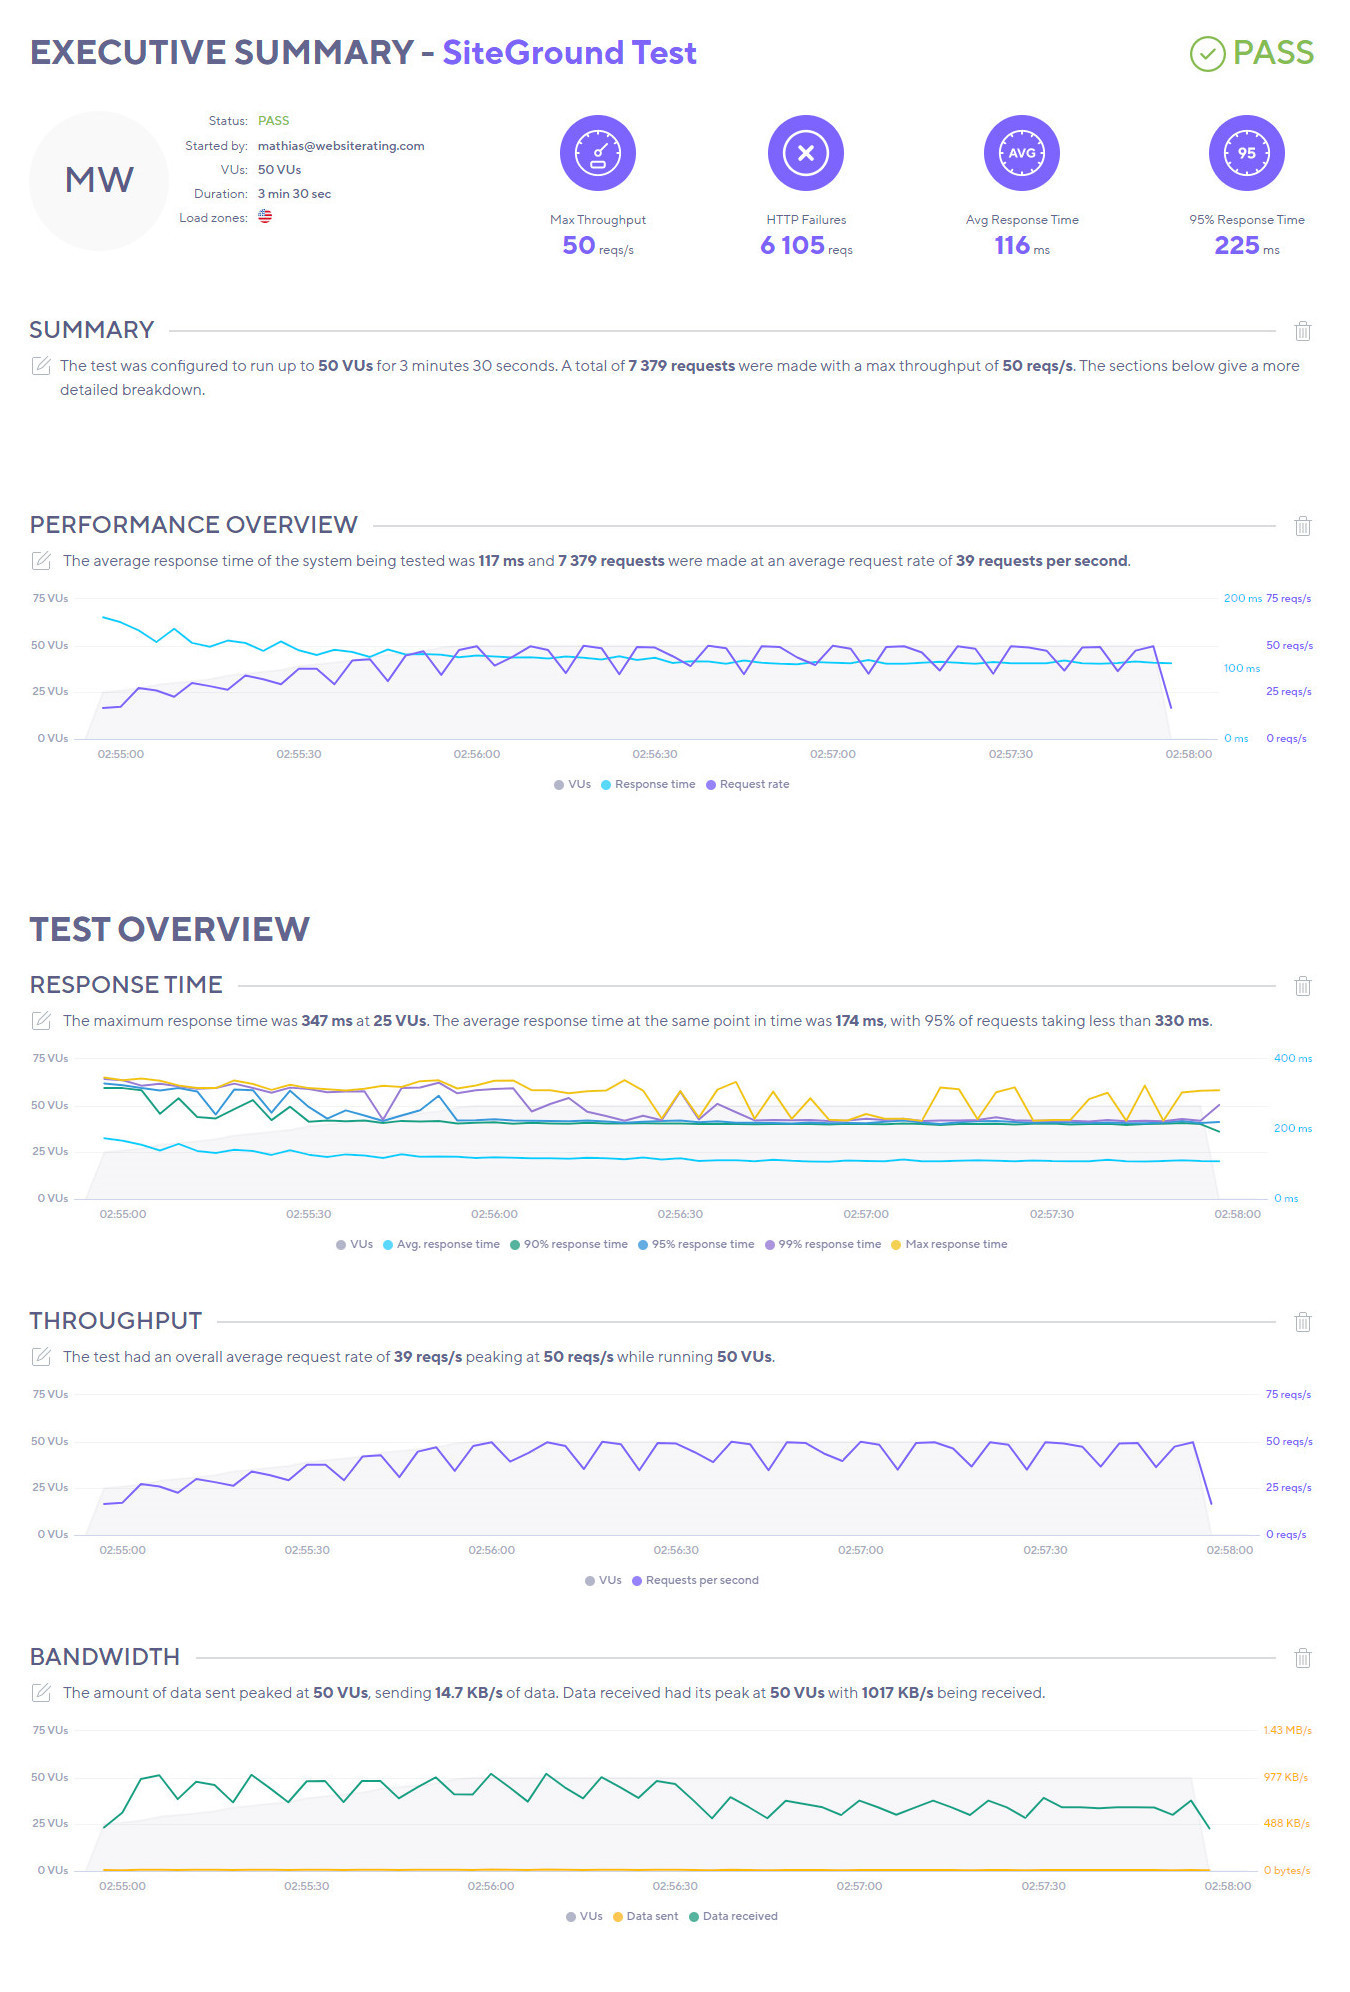
Load impact stress testing determines how the web host would handle 50 visitors simultaneously visiting the test site. Speed testing alone isn’t enough to test performance, as this test site doesn’t have any traffic to it.
To be able to evaluate the efficiency (or inefficiency) of a web host’s servers when faced with increased site traffic, we used a testing tool called K6 (formerly called LoadImpact) to send virtual users (VU) to our test site and stress test it.
These are the three load impact metrics we measure:
Average response time
This measures the average duration it takes for a server to process and respond to client requests during a specific test or monitoring period.
The average response time is a useful indicator of the overall performance and efficiency of a website. Lower average response times generally indicate better performance and a more positive user experience, as users receive quicker responses to their requests.
Maximum response time
This refers to the longest duration it takes for a server to respond to a client’s request during a specific test or monitoring period.This metric is crucial for evaluating the performance of a website under heavy traffic or usage.
When multiple users access a website simultaneously, the server must handle and process each request. Under high load, the server may become overwhelmed, leading to an increase in response times. The maximum response time represents the worst-case scenario during the test, where the server took the longest time to respond to a request.
Average request rate
This is a performance metric that measures the average number of requests per unit of time (usually per second) that a server processes.
The average request rate provides insights into how well a server can manage incoming requests under various load conditions. A higher average request rate indicates that the server can handle more requests in a given period, which is generally a positive sign of performance and scalability.
⚡Speed & Performance Test Results
The table below compares web hosting companies’ performance based on four key performance indicators: average Time to First Byte, First Input Delay, Largest Contentful Paint, and Cumulative Layout Shift. Lower values are better.
| Company | TTFB | Avg TTFB | FID | LCP | CLS |
|---|---|---|---|---|---|
| SiteGround | Frankfurt: 35.37 ms Amsterdam: 29.89 ms London: 37.36 ms New York: 114.43 ms Dallas: 149.43 ms San Francisco: 165.32 ms Singapore: 320.74 ms Sydney: 293.26 ms Tokyo: 242.35 ms Bangalore: 408.99 ms | 179.71 ms | 3 ms | 1.9 s | 0.02 |
| Kinsta | Frankfurt: 355.87 ms Amsterdam: 341.14 ms London: 360.02 ms New York: 165.1 ms Dallas: 161.1 ms San Francisco: 68.69 ms Singapore: 652.65 ms Sydney: 574.76 ms Tokyo: 544.06 ms Bangalore: 765.07 ms | 358.85 ms | 3 ms | 1.8 s | 0.01 |
| Cloudways | Frankfurt: 318.88 ms Amsterdam: 311.41 ms London: 284.65 ms New York: 65.05 ms Dallas: 152.07 ms San Francisco: 254.82 ms Singapore: 295.66 ms Sydney: 275.36 ms Tokyo: 566.18 ms Bangalore: 327.4 ms | 285.15 ms | 4 ms | 2.1 s | 0.16 |
| A2 Hosting | Frankfurt: 786.16 ms Amsterdam: 803.76 ms London: 38.47 ms New York: 41.45 ms Dallas: 436.61 ms San Francisco: 800.62 ms Singapore: 720.68 ms Sydney: 27.32 ms Tokyo: 57.39 ms Bangalore: 118 ms | 373.05 ms | 2 ms | 2 s | 0.03 |
| WP Engine | Frankfurt: 49.67 ms Amsterdam: 1.16 s London: 1.82 s New York: 45.21 ms Dallas: 832.16 ms San Francisco: 45.25 ms Singapore: 1.7 s Sydney: 62.72 ms Tokyo: 1.81 s Bangalore: 118 ms | 765.20 ms | 6 ms | 2.3 s | 0.04 |
| Rocket.net | Frankfurt: 29.15 ms Amsterdam: 159.11 ms London: 35.97 ms New York: 46.61 ms Dallas: 34.66 ms San Francisco: 111.4 ms Singapore: 292.6 ms Sydney: 318.68 ms Tokyo: 27.46 ms Bangalore: 47.87 ms | 110.35 ms | 3 ms | 1 s | 0.2 |
| WPX Hosting | Frankfurt: 11.98 ms Amsterdam: 15.6 ms London: 21.09 ms New York: 584.19 ms Dallas: 86.78 ms San Francisco: 767.05 ms Singapore: 23.17 ms Sydney: 16.34 ms Tokyo: 8.95 ms Bangalore: 66.01 ms | 161.12 ms | 2 ms | 2.8 s | 0.2 |
- TTFB (Time to First Byte): This measures the responsiveness of the web server. Lower values are better as they represent a faster initial response.
- WPX Hosting has an average TTFB of 161.12 ms.
- SiteGround has a slightly higher average TTFB of 179.71 ms.
- FID (First Input Delay): This measures interactivity and responsiveness. It’s the time from when a user first interacts with your site to the time when the browser is able to respond to that interaction. Lower values are better.
- WPX Hosting has an FID of 2 ms.
- SiteGround has an FID of 3 ms.
- LCP (Largest Contentful Paint): This measures loading performance. It’s the time it takes to render the largest content element visible in the viewport. Lower values are better.
- WPX Hosting has an LCP of 2.8 seconds.
- SiteGround has a lower LCP of 1.9 seconds.
- CLS (Cumulative Layout Shift): This measures visual stability. It quantifies how much a page’s content visually shifts around. A lower CLS is better.
- WPX Hosting has a CLS of 0.2.SiteGround has a significantly lower CLS of 0.02.
WPX Hosting has slightly better TTFB and FID scores, SiteGround outperforms WPX Hosting in LCP and significantly in CLS.
⚡Load Impact Test Results
The table below compares web hosting companies’ performance based on three key performance indicators: Average Response Time, Highest Load Time, and Average Request Time. Lower values are better for Average Response Time and Highest Load Time, while higher values are better for Average Request Time.
| Company | Avg Response Time | Highest Load Time | Avg Request Time |
|---|---|---|---|
| SiteGround | 116 ms | 347 ms | 50 req/s |
| Kinsta | 127 ms | 620 ms | 46 req/s |
| Cloudways | 29 ms | 264 ms | 50 req/s |
| A2 Hosting | 23 ms | 2103 ms | 50 req/s |
| WP Engine | 33 ms | 1119 ms | 50 req/s |
| Rocket.net | 17 ms | 236 ms | 50 req/s |
| WPX Hosting | 34 ms | 124 ms | 50 req/s |
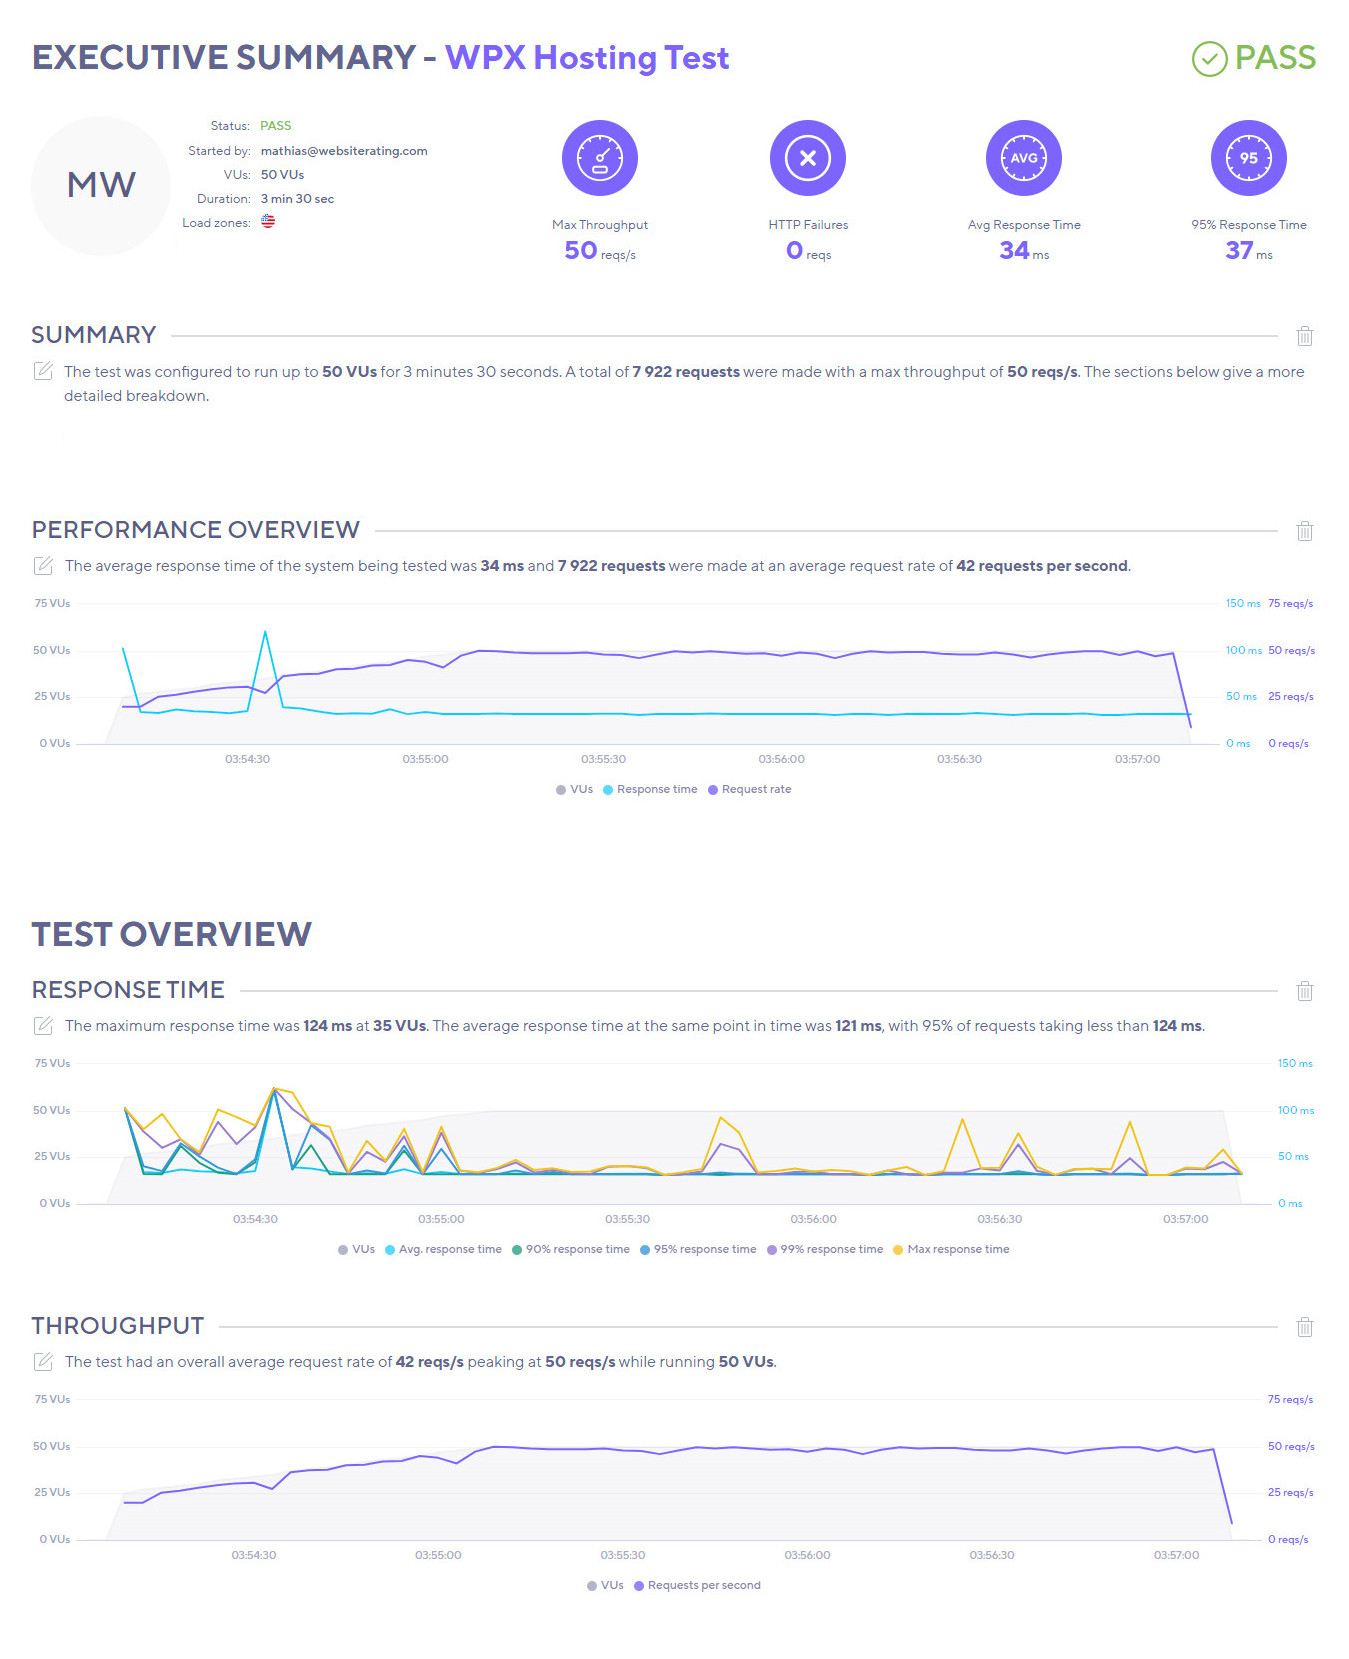
- Average Response Time: This metric measures the average time a server takes to respond to a browser’s request. Lower values are better as they represent faster response times.
- WPX Hosting has an average response time of 34 ms.
- SiteGround has an average response time of 116 ms.
- Highest Load Time: This measures the maximum time it takes for a page to load completely. Again, lower values are better because they represent faster load times.
- WPX Hosting has a highest load time of 124 ms.
- SiteGround has a highest load time of 347 ms.
- Average Request Time: This measures the average number of requests a server can handle per second. Higher values are better because they represent higher capacity.
- Both WPX Hosting and SiteGround have an average request time of 50 requests per second.
WPX Hosting outperforms SiteGround in both Average Response Time and Highest Load Time, offering faster response and load times. However, both WPX Hosting and SiteGround have the same capacity in terms of the number of requests they can handle per second. If response and load times are a priority for your website, WPX Hosting would be a better choice based on these metrics.
WPX Hosting Performance Features
Since WPX Hosting is independently owned, it has created its technology from the ground up, forcing itself to innovate along the way. Borne out of this innovation is the XDN – a hand-built content delivery network (CDN).

This excellent CDN network has over 30 endpoints (which they are constantly expanding) and, during independent speed tests, performed the best overall and significantly faster than SiteGround (almost 3x faster).
In terms of primary data centers, WPX Hosting has three locations in Australia, the UK, and the USA.
A really nice extra goodie that I found highly useful was taking WPX Hosting up on its free professional speed optimization. This is a one-time thing where a member of the WPX team will optimize your site to improve.
Ultimately, you’re going to get a WordPress site that runs like a dream without ever having to understand the tech behind it. I think that’s such a useful bonus, especially for those less technically inclined.
Another nice-to-have is the inclusion of a free fix if your site goes down. Most of the time, you’re left to fend for yourself or pay extra for such a service. Again, this is a great bonus included with all plans.

For its hardware, WPX Hosting makes use of LiteSpeed servers (built to handle HTTP/2 easily) which come equipped with LiteSpeed Cache and OPcache.
The LiteSpeed Cache delivers built-in page speed and image optimization providing excellent page load speeds without having to invoke PHP. This tech consistently performs better than Nginx and Apache to deliver the fastest WordPress experience (up to ten times better).
The use of OPcache can also significantly improve page speeds (up to three times better). This is a PHP OPcode caching system that saves precompiled script bytecode in the LiteSpeed server cache memory allowing page data to be loaded far more efficiently.
To finish off, WPX Hosting utilizes ultra-reliable SSD storage and includes unlimited MySQL and phpMyAdmin access allowing you to create and manage custom databases.
SiteGround Performance Features
SiteGround achieves its stellar reliability by using the Google Cloud Platform. This is best-in-class technology and is world-renowned for providing low latency and high availability across all your hosting sites.
SiteGround makes use of ten enterprise-class UPS technology data centers globally. This is what you can thank for the uninterrupted network plus the top-tier level of redundancy for its critical components.

SiteGround’s CDN 2.0 is guaranteed to increase your website’s speed. On average, you can expect a 20% uptick in loading speed; for some specific global regions, that number could even double! This is made possible by harnessing the capabilities of Anycast routing and Google network edge locations. Enjoy this seamless, speedy experience!
What is a CDN? It’s highly powerful tech that provides super-boosted speeds. It manages this by caching your site content and distributing it to each of SiteGround’s server sites (right now, this is 16 locations worldwide).
Then, when someone visits your website, they will be served up the data from the closest CDN location, meaning there’s less wait time and lag since it doesn’t have so far to travel.
The CDN can also automatically detect and then auto-block malicious traffic. This means you don’t waste time trying to deal with malware because you won’t even know it was trying to get there in the first place.

Rather than patch together a bunch of third-party caching software, SiteGround has developed its own proprietary SuperCacher software. This consists of a three-tiered caching setup for database queries and dynamic pages.
Here’s what each level does:
- NGINX Direct Delivery: Caches static web content and stores it in the server’s RAM
- Dynamic Cache: A full-page cache for non-static page elements boosting TTFB
- Memcached: Accelerates dynamic content loading times and improves application and database connections
SiteGround users can also enjoy its custom MySQL. If you have a lot of heavy MySQL queries, then this piece of software really shines.
It works by allowing lots of parallel requests to be processed at the same time. This drastically reduces slow query numbers by about 10 – 20x.

SiteGround provides many different hosting types, but it is particularly beneficial for WordPress sites. This is thanks to SiteGround’s WordPress Optimizer plugin, which is included with all managed WordPress plans.
The plugin delivers extra efficiency by allowing you to switch on the HTTPS option and set the optimal PHP version for your site (8.0 and 8.1 included). Furthermore, you get a range of image optimization tools, such as lazy-loading and minification for CSS and HTML.
WordPress users can also enjoy automatic updates, GZIP, and Brotli compression.
🏆 Winner is WPX Hosting
While SiteGround provides more detail about the technology it uses, the proof is in the pudding. WPX consistently performs the best out of the two hosting providers, and that’s all you really need to know.
In our performance testing based on various key metrics, WPX Hosting consistently outperformed SiteGround in most areas.
In terms of server response times, measured as Time to First Byte (TTFB) and Average Response Time, WPX Hosting was significantly quicker, offering faster response times for users. WPX Hosting was also better in terms of interactivity, measured as First Input Delay (FID), responding more swiftly to user interactions.
While SiteGround was faster at loading the largest visible element on the page (measured as Largest Contentful Paint), and offered superior visual stability (measured as Cumulative Layout Shift), the differences in server response times and load times were notable. Specifically, in the second test, WPX Hosting demonstrated a much faster Highest Load Time compared to SiteGround.
Both WPX Hosting and SiteGround showed similar capabilities in handling server requests, measured as Average Request Time, with both being able to manage 50 requests per second.
Overall, based on these combined metrics, WPX Hosting proved to offer superior performance compared to SiteGround, especially considering the key areas of server response times, user interactivity, and page load times. So, for users prioritizing these aspects, WPX Hosting would likely be a more suitable choice.
Security Features
Next up, let’s find out what security measures each platform takes to keep your WordPress sites safe.
WPX Hosting Security Features

WPX Hosting doesn’t disappoint in the security department and provides much of what you’d expect in terms of security features:
- Malware detection and removal
- Brute force protection
- Automatic daily backups
- 28-day backup retention
- Free SSL certificates
- WAF monitoring and filtering to block malicious traffic
- ModSecurity firewall with daily scans
- Imperva DDoS attack protection
- Two-factor authentication
- Automatic WordPress updates
- reCAPTCHA installation
- Free domain WHOIS protection
SiteGround Security Features

SiteGround offers plenty of security and, therefore, a lot of reassurance to its subscribers. Here’s what you get:
- WAF plus continuous patching
- AI anti-bot protection
- Brute force attack prevention
- In-house server monitoring system with auto-detection and fixing
- Automatic daily backups
- Geographically distributed 30-day backup copies
- Up to five manual backup copies
- Standard SSL or Wildcard SSL for free
- Site Scanner malware early detection
- One-click staging
- Failed login monitoring and filtering
- Hardware and software DDoS protection and filtering
- Free SiteGround WordPress security plugin:
- Site hardening rules
- 2-factor authentication
- Activity log
🏆 Winner Is WPX
Both platforms are much the same for security. They each offer standard features for most hosting providers, with one notable difference.
SiteGround has its free WordPress security plugin that provides enhanced security for all its hosted WordPress sites. But WPX’s free malware and hack removal is a fantastic service. This, in my opinion, gives it the edge over SiteGround.
Technical Support
Finally, let’s see what type of support we can look forward to with either platform.
WPX Hosting Technical Support

Customers rave about WPX Hosting’s support, and this is reflected in the reviews it receives.
Live chat support is provided around the clock (24/7 365) for members as well as non-members, plus you get access to an email ticketing system for complex problems.
Furthermore, its response time is an average of 30 seconds, and when we tested this out, they surpassed this by responding instantly.
I also have to say that WPX Hosting’s knowledge base is superior, with easy-to-find and follow articles that explain everything in plain English. Something that I generally find lacking in hosting providers since they tend to be too technical for the average reader.
SiteGround Technical Support
SiteGround’s support is also plentiful and provides a number of methods to get in touch. First of all, you can contact live chat support 24/7.
Customers can also call SiteGround’s support team. The phone number differs depending on where the customer is based, and an access code will be required to ensure identification. Both the number and the access code become available when you log into the client area and click to contact customer service.
For complex issues that need a lot of troubleshooting, there is also an email ticketing service available.
When testing out these contact methods, we found live chat and answering the phone was virtually instantaneous, and getting a response from an email ticket took around an hour.
🏆 Winner is SiteGround
Both SiteGround and WPX Hosting have excellent customer service levels, and you can’t go wrong with either of them. However, I can’t ignore the legions of fans that praise SiteGround for its stellar service. For this to feature time and time again in online reviews, then it must be something truly special.
Our Verdict ⭐

|
|
|
From $2.99 per month
|
From $20.83 per month
|
|
Description: Types of hosting: Shared, WordPress, WooCommerce, Cloud Key Features: Top website performance with Ultrafast PHP, optimized db setup, built-in caching & more! The ultimate offer packed with free email, SSL, CDN, backups, WP auto-updates and more. Best for: Serious website owners looking for a web host with great speed, strong security. |
Description: Types of hosting: WordPress Key Features: Fast WordPress hosting features including LiteSpeed server + caching, OpCache, XDN CDN, free site speed optimization, and free offline site fixes. Best for: Serious WordPress users looking for a trusted web hosting partner. |
Types of hosting: Shared, WordPress, WooCommerce, Cloud
Key Features: Top website performance with Ultrafast PHP, optimized db setup, built-in caching & more! The ultimate offer packed with free email, SSL, CDN, backups, WP auto-updates and more.
Best for: Serious website owners looking for a web host with great speed, strong security.
Types of hosting: WordPress
Key Features: Fast WordPress hosting features including LiteSpeed server + caching, OpCache, XDN CDN, free site speed optimization, and free offline site fixes.
Best for: Serious WordPress users looking for a trusted web hosting partner.
I can’t believe I’m doing this, but I will have to declare a draw!
I honestly can’t decide which platform is best here. Even though I’m a massive SiteGround fan, I can’t deny that WPX Hosting is faster, performs better, and has hoards of customer service fans.
On the other hand, SiteGround is more affordable than WPX while still providing a more-than-highly respectable level of performance and speed.
So, if you want the fastest speeds possible, choose WPX Hosting. If a cheaper price is more important to you, choose SiteGround.
How We Review Web Hosts: Our Methodology
When we review WordPress web hosts like SiteGround or WPX hosting, our evaluation is based on these criteria:
- Value for Money: What types of web hosting plans are on offer, and are they good value for money?
- User Friendliness: How user-friendly is the signup process, the onboarding, the dashboard? and so on.
- Customer Support: When we need help, how quickly can we get it, and is the support effective and helpful?
- Hosting Features: What unique features does the web host provide, and how do they stack up against competitors?
- Security: Are essential security measures like SSL certificates, DDoS protection, backup services, and malware/virus scans included?
- Speed and Uptime: Is the hosting service fast and reliable? What types of servers do they use, and how do they perform
For more details on our review process, click here.